DECISION TOOL
There are two worksheets in this tool, with the CBB-accounted programs in one worksheet (Existing) and newly proposed programs in the other (New). Both worksheets contain the following three common objects:
▸ Slicer: Filter programs and departments
▸ Result box: Summarize budget results based on the decisions
▸ Bar chart: Display distribution of funds and number of programs to implement by department
In both worksheets, there is a column called “Decision”. Once a decision is entered for a program, both the result box and bar chart will be updated reflecting the change.
“Existing” worksheet
The Existing worksheet includes 31 CBB-accounted existing programs. The default view (See Figure 1 below) shows the 9 end-of-cycle programs. If you clear this filter by clicking on the “Clear Filter” icon highlighted in red circle, all 31 programs will be displayed.
According to the “Result Box” in Figure 1, under the current scenario, 3 out of the 9 end-of-cycle programs are renewed. As a result, $18.20 million of the existing $21.98 million recurrent spending will be sustained and $3.78 million will be saved from discontinuing the other 6 end-of-cycle programs. At the same time, 8 new programs requesting $8.16 million are approved. Since the saving falls short of covering the desired new expenses, adjustments have to be made.

Figure 1 Default view of Existing worksheet
Figure 1 shows that, under the current scenario, Dept 4 will be in charge of the largest amount of combined investments, which include 1) CBB-accounted existing programs that have not reached the end of continuous improvement cycle (In-cycle), 2) renewed end-of-cycle programs, and 3) new programs. The wider bar in the back shows that these investments involve 8 programs. Hovering the mouse over each subsection of the bar shows the corresponding amount of investments. For example, $11.6 million of the combined investments comes from renewed end-of-cycle programs (See Figure 2 below). Let’s take a closer look at these 8 programs. First, click on “Dept 4” in the Department slicer to show the end-of-cycle programs for Dept 4 only. Next, press and hold the “Ctrl” key and click on “In-cycle” in the CBB status slicer to include the In-cycle existing programs.

Figure 2 Dept 4 details in Existing worksheet
Now, for each existing In-cycle program, the Existing worksheet shows its: 1) title, 2) cost; 3) start year, and 4) continuous improvement cycle. To look at the new program Dept 4 will be implementing, let’s turn our attention to the New worksheet. Since these six programs are still “In-cycle”, there is no need to make decisions on these programs. However, information about these “In-cycle” programs as well as the renewed end-of-cycle programs should propel decision makers to ask whether it is a good idea to approve any new request from Dept 4, which will be further discussed in the DECISION RULES section.
“New” worksheet
The default view of the New worksheet (See Figure 3 below) already has Dept 4 selected in the Department slicer. Dept 4 submitted 7 new proposals and has just one approved (New program 7) in the current scenario. Compared to other programs, however, New program 7 has a very high cost per pupil rate of $2,500 per student. Despite that New program 7 is intended to meet a critical need of those 100 students, the potential benefits probably do not warrant such a high cost. Considering that Dept 4 already has 7 programs to focus on implementing, the district might want to consider another new program proposed by a different department that could benefit those 100 students, but at a lower cost.

Figure 3 Default view of New worksheet
As a result of the above deliberation, it is decided to “Decline” New program 7. To do that, click on cell K8 where “Approve” is the current value. Next, click on the drop-down triangle appearing on the right of the cell and select “Decline” (See Figure 4 below).
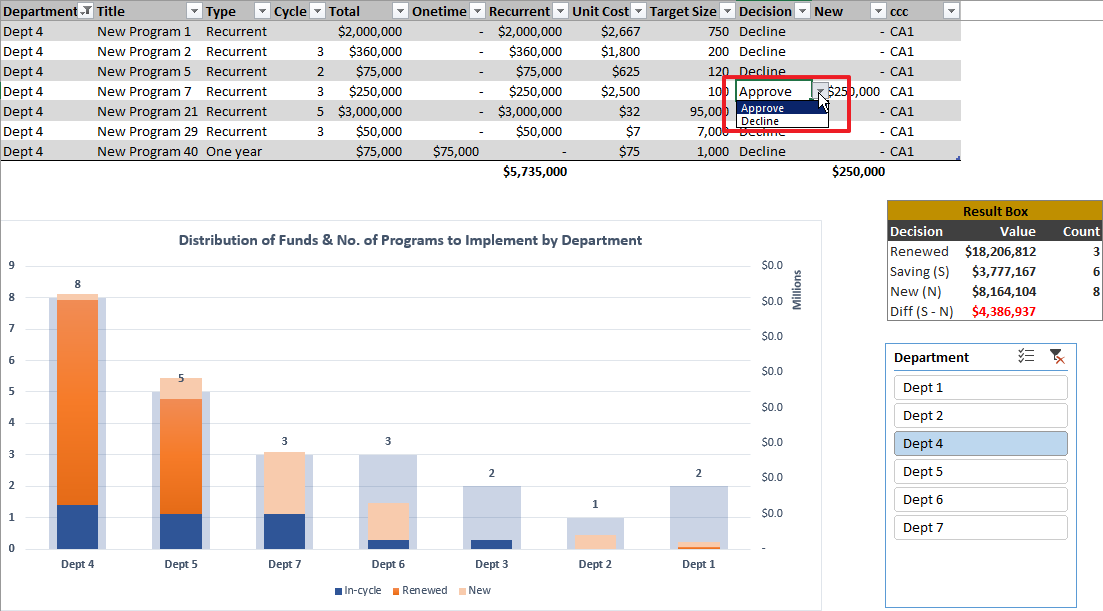
Figure 4 Decision change in New worksheet
After the above steps, both the “Result box” and “Bar chart” will be updated, showing that 7 new programs totaling $7.14 million are approved, the deficient is reduced to $4.14 million, and Dept 4 will implement 7 programs concurrently in 18-19 (See Figure 5). Apparently, the job is not done yet. Following the scrutinization of Dept 4, , attention should be turned to other departments. If there remains a deficit after every department is examined, leaders might have to go back to take another look at the decisions made earlier on both the end-of-cycle and new programs, until the approved new programs can be fully covered by either savings from discontinuing some end-of-cycle programs or additional revenue.
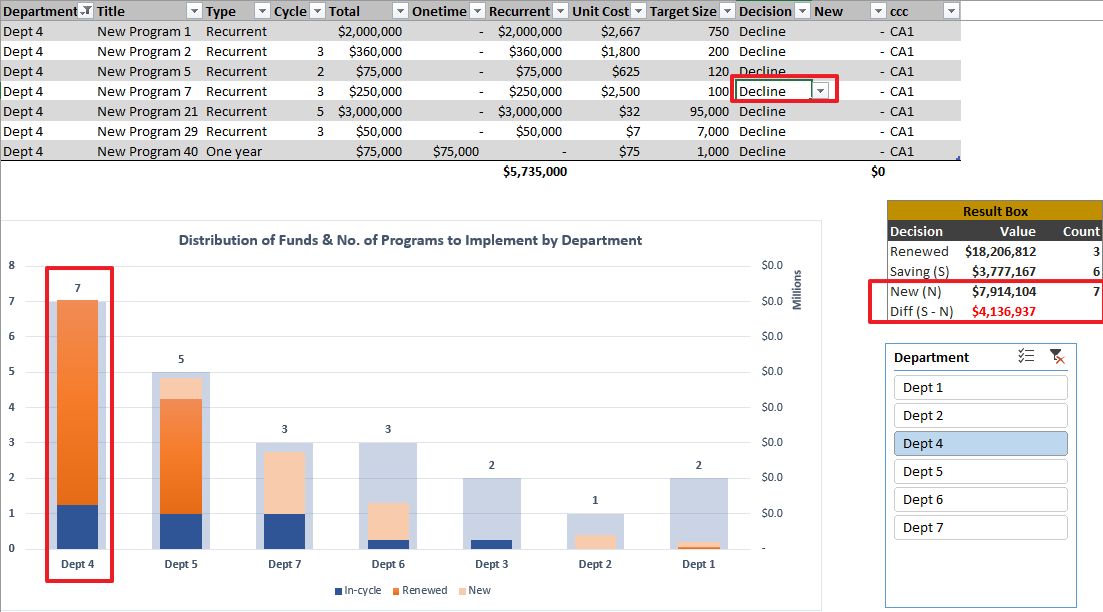
Figure 5 Decision result under the new scenario
DECISION RULES
Deliberation on budget decisions is both a complex and dynamic process, which is influenced and shaped by myriads of factors. One way to improve the process is to explicitly identify and select those factors, and further develop a set of rules that can be either sequential or parallel to guide the decision making.
Embedded in this Decision Tool are two factors: 1) cost per pupil and 2) number of programs to implement concurrently by a department. Based on these two factors, two decision rules are applied in the above exercise, which leads to change in decisions and a new budget scenario. Of the two factors, cost per pupil has to do with the true cost of programs and number of programs to implement concurrently by a department is concerned with capacity.
Rule 1: Preference should be given to programs with a low cost per pupil rate than those with a high cost per pupil rate when other things are balanced
Contrary to the misperception that people in education don’t care about costs, educators do care about costs and many times a program with a higher total cost gives way to another program with a lower total cost because of the thinking that the latter is cheaper. The problem is that total cost is a misleading number and the real measure of cost should be cost per pupil. For example, in Figure 2, Existing program 10 (total cost $285,882) is more than twice as expensive as Existing program 9 (total cost $100,000). When the number of students that will be served is considered, on the contrary, Existing program 10 is actually much cheaper than Existing program 9, with a cost per pupil rate of one-fifth of that of the ostensibly cheaper Existing program 9.
Part of the reason for the current focus on total cost instead of the true measure of cost per pupil is that how many students will be served is often times not a well-thought-of aspect when a new program is proposed. Even when the number is available at the time, it is not routinely documented and used in decision making. Requiring this important number in budget request and documenting it in your system are the first step to establishing it as a rule for budget decisions. After a few years of collecting cost per pupil information, you will be able to develop a local norm for economical, acceptable, and expensive cost per pupil levels, which can be used to guide decisions when applying this rule.
It should be pointed out that cost as a general concept can be interpreted and executed quite differently in different districts, depending on data availability, staff capacity, system sophistication, and local politics. For example, the cost of a program might be simply interpreted and executed in one district as the additional monetary expenses for launching and sustaining the program, which include nothing else but staff salary, benefits as well as operational costs; but another district might expand the concept of cost to include institutional energy needed to implement the program and opportunity cost. Regardless of how cost is defined and measured, it is important to factor in the number of students to be served and use cost per pupil as the yardstick for comparing cost.
Rule 2: The number of programs a department can implement concurrently should not exceed its capacity
We all know multi-tasking can impact a person’s performance because our cognitive capacity limits how much we can concentrate on and do well at one time. Organizations are the same. When the number of programs a district or a central office department is implementing exceeds its capacity, things will be overlooked or ignored and there is a much higher probability of making mistakes. At best, some programs get implemented well by sacrificing the attention and energy needed for the other programs. At worst, people can be overwhelmed by all kinds of problems that compound each other and spend most of their time putting out fires instead of focusing on implementing the programs.
Compared to the first rule, it can be tricky to apply this rule for budget decisions at the early stages of CBB adoption. First, there is no straightforward measure of departmental capacity. To further complicate the issue, a department’s capacity is probably relative to the scale and complexity of the programs to be implemented. With that said, as more budget decisions and program outcome data are collected, districts will be empowered to make individualized evaluation of whether the number of programs to be implemented is within or beyond a department’s capacity.
For example, if a department launched three programs in the past three years and none of them was successfully implemented, then it is probably debatable whether the department should continue to run the three programs as originally planned. In contrast, if another department initiated two programs in the past three years and both of them were successfully implemented (which may or may not lead to expected outcomes depending on the effectiveness of the programs), it is probably acceptable to add one more to that department’s plate.
SUMMARY
As mentioned earlier, budget decisions are influenced and impacted by many factors. A good decision tool should incorporate all of the factors selected for decision making, so that the decision rules developed based on those factors can be applied with the corresponding data. This Decision Tool incorporates two factors (cost per pupil and number of programs to be implemented concurrently) that allow the two aforementioned decision rules to be applied. The data points are relatively easy to collect and compile, and the two decision rules are simple to apply and yet powerful in impacting decisions.
Apparently, this Decision Tool is not entirely sufficient yet for facilitating budget decisions because some important factors are missing, such as alignment with district’s priorities, evidence of effectiveness (for new programs), and academic return on investment (for existing programs). These factors will be incorporated in future versions of the CBB Decision Tool.